8.2.6 Zabbix Installation and Configuration on a Server

Zabbix is a powerful open-source monitoring system. It allows you to monitor the status of servers, networks, applications, databases, and even cloud environments in real time. Zabbix is widely used both in small businesses and large corporate infrastructures.
Key features of Zabbix:
- Detects issues before they affect users;
- Automatic notifications via Email, Telegram, Slack, or SMS;
- Visualization: dashboards, charts, maps;
- Templates for common systems (Linux, MySQL, Docker, etc.);
- Scalability: supports Zabbix Proxy and clustered configurations.
System Requirements
To successfully run Zabbix, you’ll need:
System Preparation
Let’s start by updating the system and installing the required utilities:
apt update && apt upgrade -y
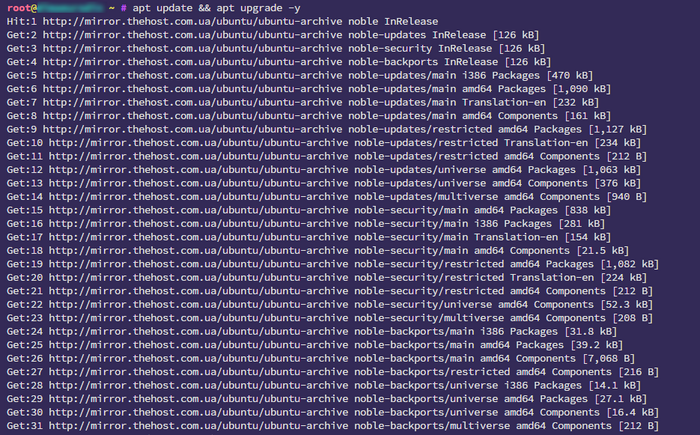
This helps to avoid conflicts during installation and ensures you have the latest package versions.
Adding the Zabbix Repository
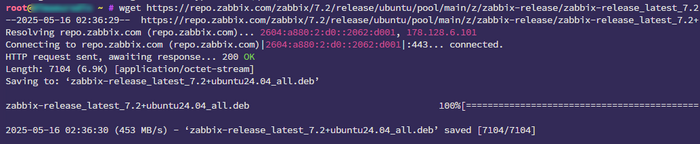
Zabbix is not included in the default Ubuntu repositories, so you need to manually add the official package:
wget https://repo.zabbix.com/zabbix/7.2/release/ubuntu/pool/main/z/zabbix-release/zabbix-release_latest_7.2+ubuntu24.04_all.deb
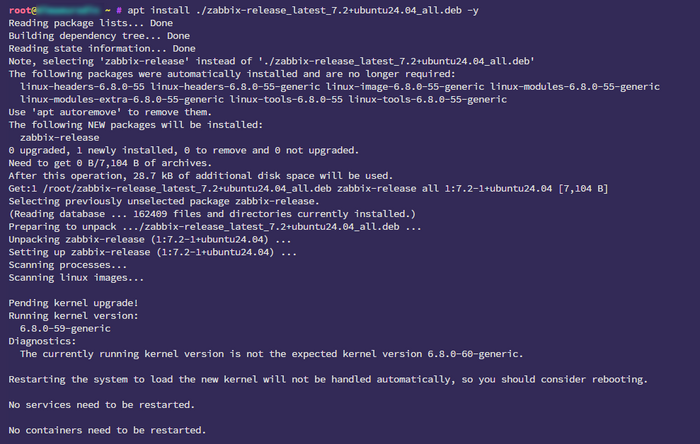
apt install ./zabbix-release_latest_7.2+ubuntu24.04_all.deb -y
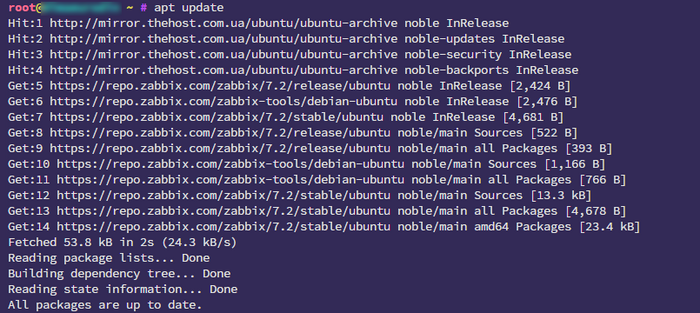
apt update
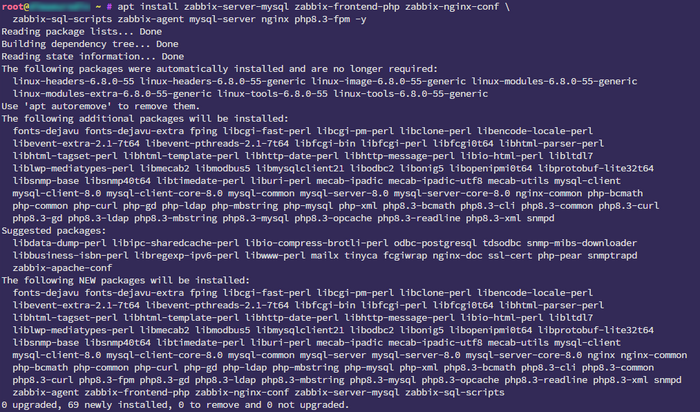
Installing Zabbix, MySQL, Nginx, and PHP Components
Info: The command below installs all the main components for Zabbix to work: the server, agent, web frontend, web server, PHP, and MySQL database.
apt install zabbix-server-mysql zabbix-frontend-php zabbix-nginx-conf \
  zabbix-sql-scripts zabbix-agent mysql-server nginx php8.3-fpm -y
MySQL Database Configuration
Zabbix installation requires creating a separate database and user:
mysql -u root -p
CREATE DATABASE zabbix CHARACTER SET utf8mb4 COLLATE utf8mb4_bin;
CREATE USER 'zabbix'@'localhost' IDENTIFIED BY 'your_zabbix_password';
GRANT ALL PRIVILEGES ON zabbix.* TO 'zabbix'@'localhost';
SET GLOBAL log_bin_trust_function_creators = 1;
EXIT;
Now import the database schema:
zcat /usr/share/zabbix/sql-scripts/mysql/server.sql.gz | \
  mysql --default-character-set=utf8mb4 -uzabbix -p zabbix

mysql -u root -p
SET GLOBAL log_bin_trust_function_creators = 0;
EXIT;
Warning: Never use the root account for Zabbix DB connections. Always create a separate user with limited privileges!
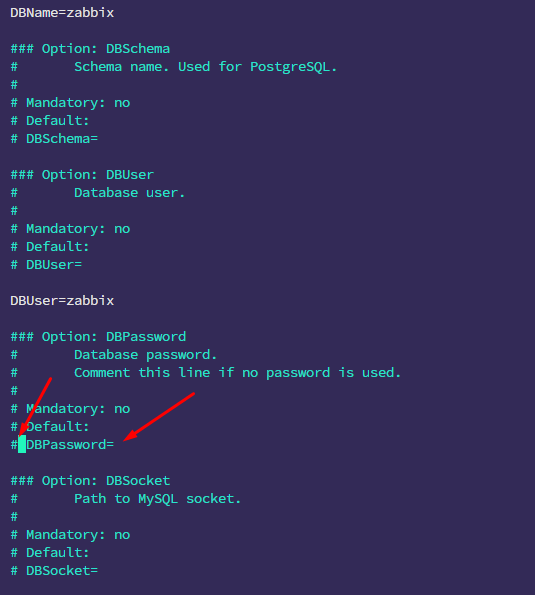
Zabbix Server Configuration
Specify the database password in /etc/zabbix/zabbix_server.conf:
nano /etc/zabbix/zabbix_server.conf
Find the line:
# DBPassword=
and replace it with:
DBPassword=your_zabbix_password
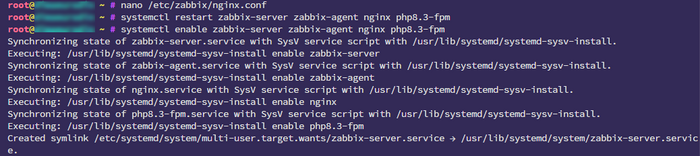
Web Interface Setup via Nginx
nano /etc/zabbix/nginx.conf
Configure the parameters:
listen 8080;
server_name your_domain_or_ip;
Starting Services
systemctl restart zabbix-server zabbix-agent nginx php8.3-fpm
systemctl enable zabbix-server zabbix-agent nginx php8.3-fpm
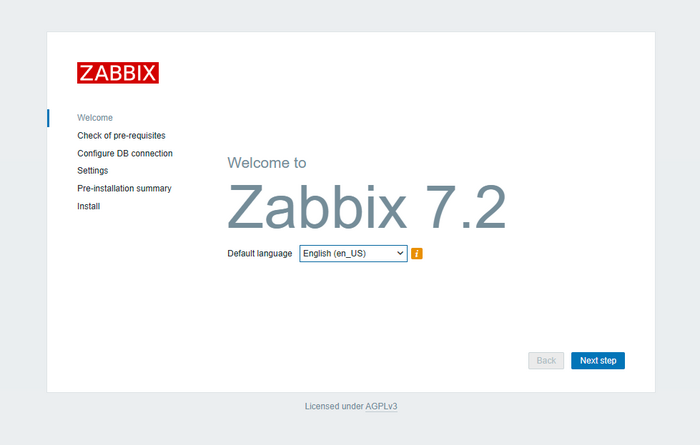
Accessing the Web Interface
Open your browser and go to:
http://<server-ip>:8080
The Zabbix setup wizard will start in your browser—choose your language:
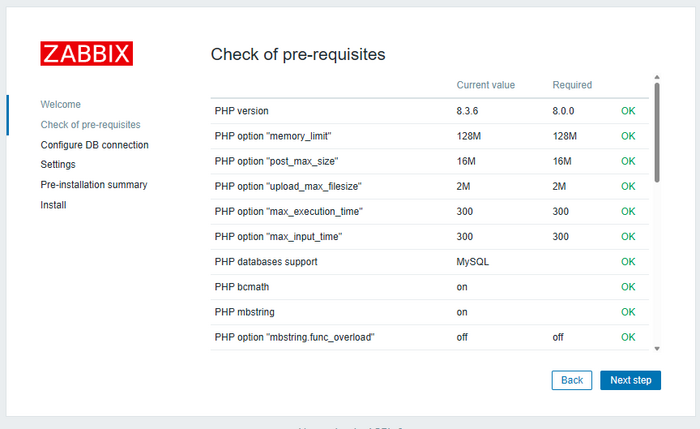
Check if your system meets the requirements:
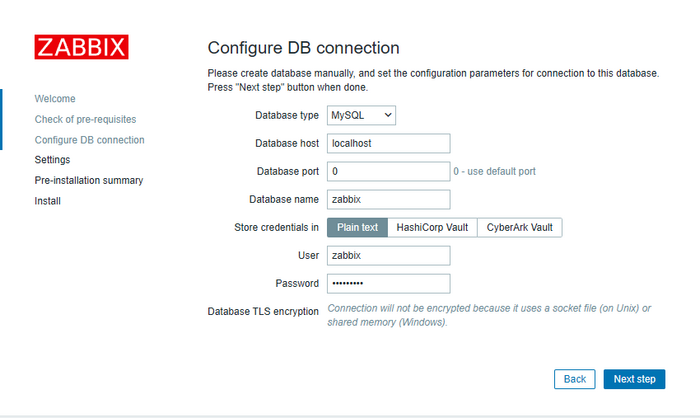
Enter the database credentials you created:
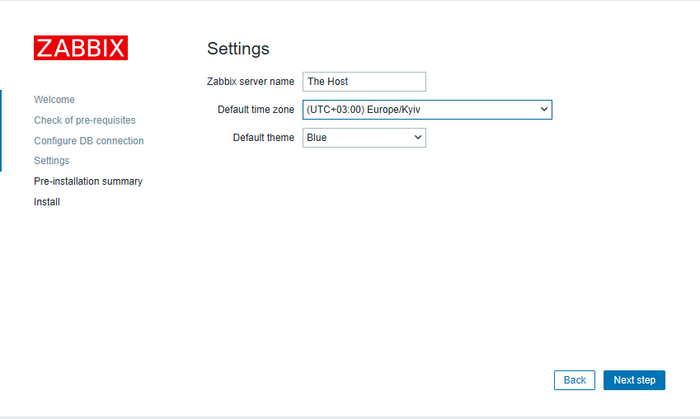
Choose your time zone:
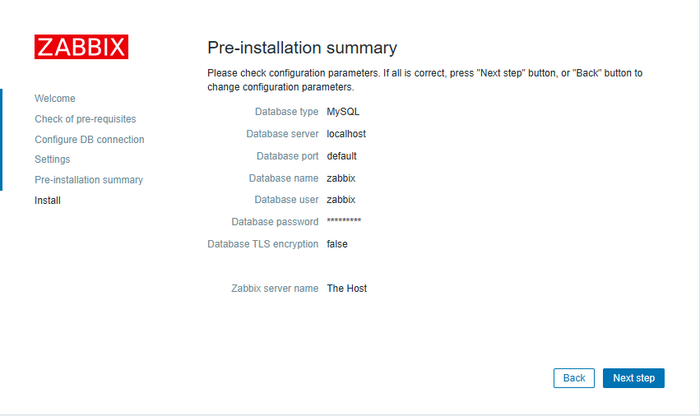
Verify that all the information is correct:
Done! Now log in with the default credentials:
Username: Admin
Password: zabbix
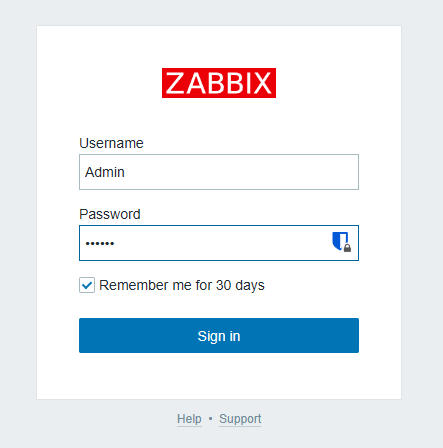
Important: After your first login, immediately change the administrator password!
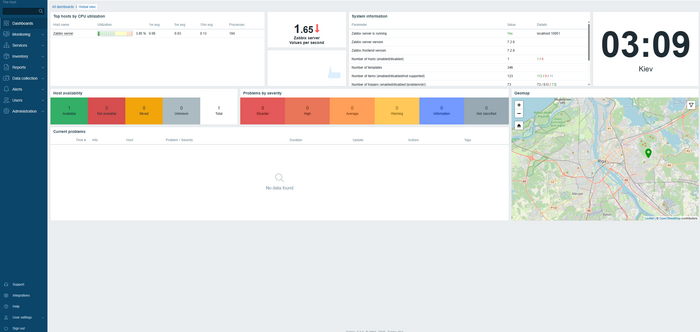
The main installation and configuration steps are complete:
Installing and Configuring the Zabbix Agent
To allow Zabbix to collect metrics from other hosts, install the agent:
apt install zabbix-agent -y
nano /etc/zabbix/zabbix_agentd.conf
Main parameters:
Server=<IP_Zabbix_Server>
ServerActive=<IP_Zabbix_Server>
Hostname=my_monitored_host
systemctl restart zabbix-agent
systemctl enable zabbix-agent
Tip: Ensure hostnames in the agent config and web interface match. This will simplify monitoring and troubleshooting.
Monitoring
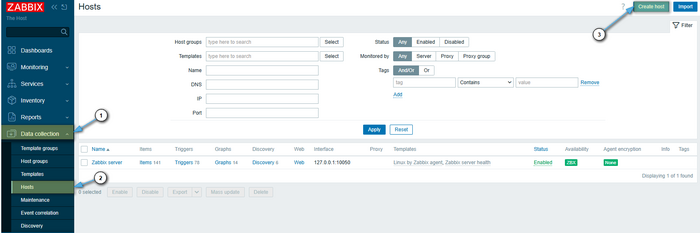
Adding a New Host via the Web Interface
-
Go to Data collection → Hosts;
-
Click Create host;
-
Fill in:
- Host name — must match the agent config;
- Interfaces — host IP, type Agent, port 10050;
- Templates — select
Template OS Linux by Zabbix agent.
Ping Monitoring
For ICMP Ping monitoring, the fping utility is required. Install it on your Zabbix Server:
sudo apt install fping
Set the correct permissions for fping:
sudo chmod +s /usr/bin/fping
sudo chmod +s /usr/bin/fping6
Go to the Zabbix web interface:
-
Open Data collection → Hosts, click Create host or select an existing host to edit and fill in the following fields:
- Host name: enter the host’s name (e.g., My_Router or Public_Web_Server).
- Visible name: (optional) a more readable name.
- Templates: enter ICMP Ping
- Host groups: select or create a group for the host.
Click Add in the “Interfaces” section.
- Type: choose Agent (even if Zabbix Agent is not installed on the target device, this is used to specify the host IP for Zabbix server/proxy).
- IP address: enter the device’s IP address.
- Port: leave the default port 10050 or any other (it’s not used directly for ping but the interface is required).
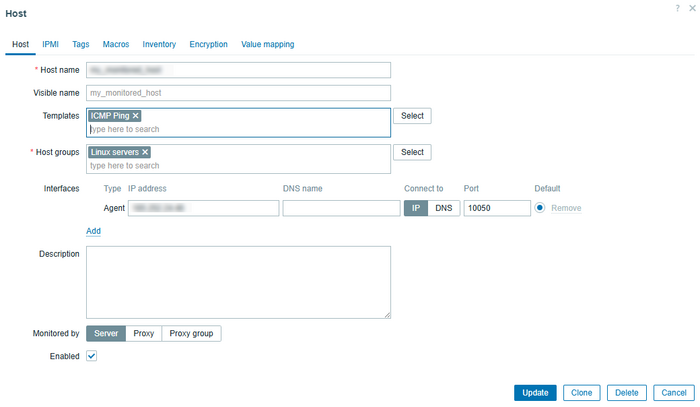
Click Add.
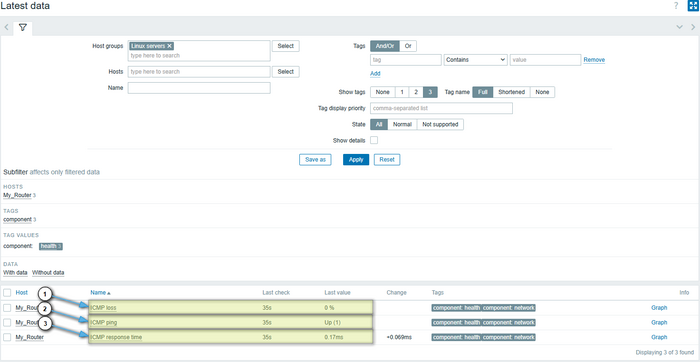
- Monitoring Data Check:
Go to Monitoring → Latest data. In the Hosts field, enter your host name and click Apply. You’ll see the following metrics related to ping:
ICMP ping— availability (1 — available, 0 — unavailable);ICMP loss— packet loss (%);ICMP response time— response time (seconds).
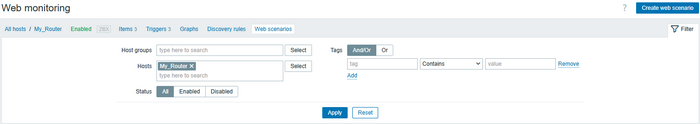
HTTP/HTTPS Monitoring
Monitoring HTTP(S) sites in Zabbix is performed using Web scenarios. They allow you to regularly check website availability, response validity, and required content.
Go to Data collection → Hosts → [Your host] → Web → Create scenario
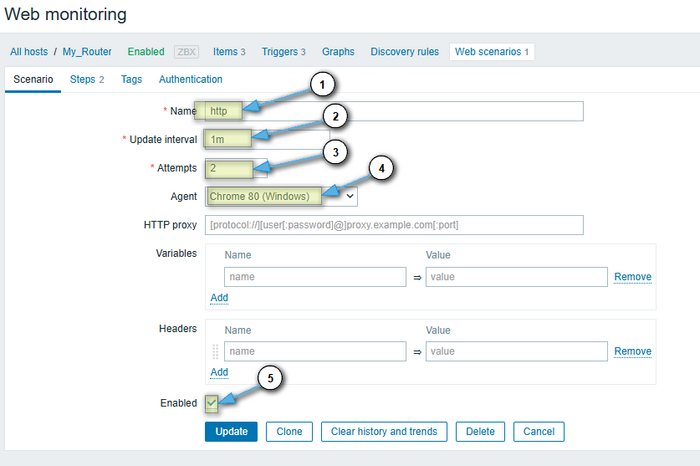
Create a scenario for http/https:
- Name: Monitoring example.com
- Application: (you can create a new one) Web checks
- Update interval: 1m
- Retries: 2
- Agent: Mozilla/5.0 (Zabbix Web Monitor)
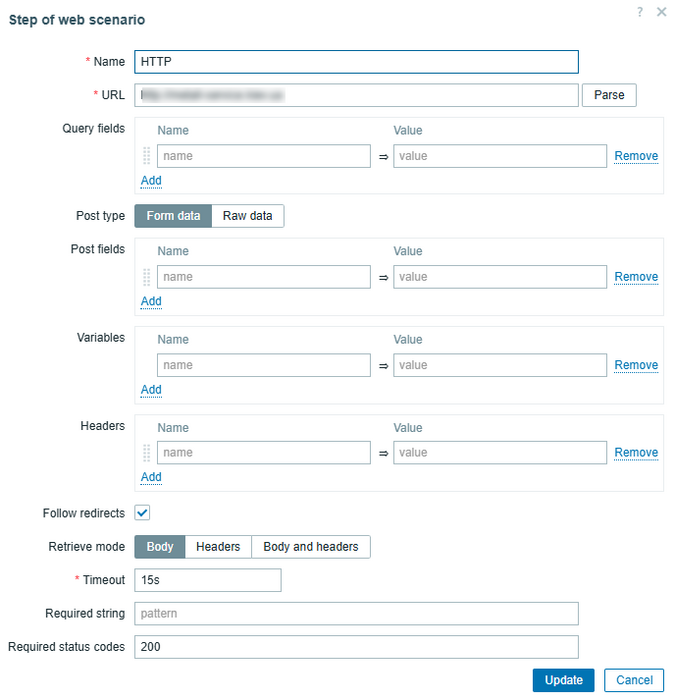
Open the Steps tab and create two steps for http and https:
- Name: Monitoring example.com
- URL: [https://example.com/]
- Follow redirects: yes
- Required status: 200
- Timeout: 15s
After setup, you’ll see these metrics for each scenario:
- Response time for step “HTTPS” of scenario “http” — step response time (in seconds). Shows how long it took from request to response.
- Response code for step “HTTPS” of scenario “http” — HTTP status code (200, 404, 503, etc.).
- Failed step of scenario “http” — the number of the step that failed (e.g., unexpected code, timeout, or missing string). If all steps pass, the value is
0. - Download speed for step “HTTPS” of scenario “http” — download speed (bytes/sec).
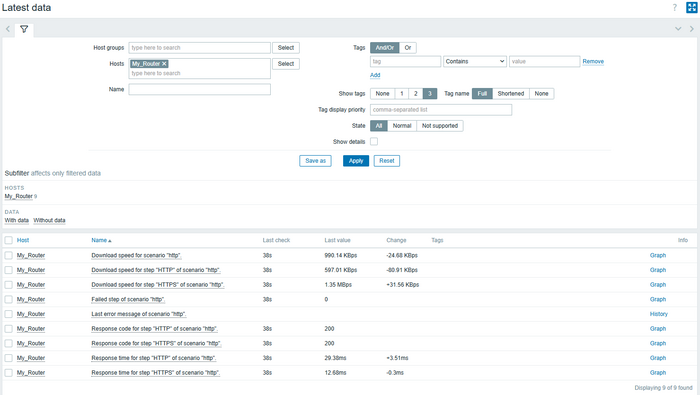
To see the metrics, go to Monitoring → Latest data. Enter the host name in the Hosts field and click Apply.
Official documentation:

